Traveling waves
19 Wave anatomy
Pulse versus wave
Flick a slinky once, and a single pulse travels down the slinky. To create a wave, you need many pulses in a row- to create a wave, the source must vibrate. If the source’s vibration is periodic, a wave will be periodic, too.
Wavelength
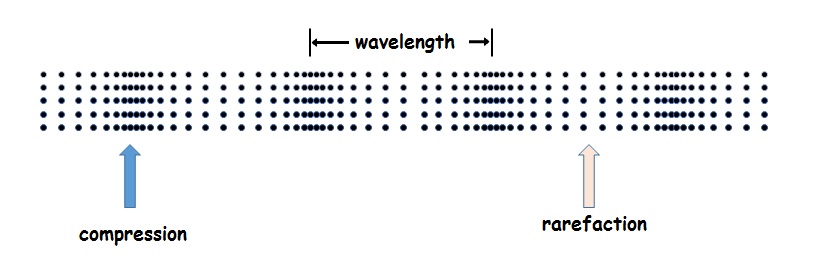
(Periodic) waves have a regular spatially repeating pattern. In transverse waves, crests (high spots on the wave) and troughs (low spots) alternate. In longitudinal waves, compressions (regions of high density) and rarefactions (regions of low density) alternate. Either way, the distance from one location on the wave to the next corresponding location is called the wavelength. Wavelength is the length of a full cycle of the wave. The symbol most books use for wavelength is the lower case Greek letter lambda ( [latex]\lambda[/latex]).
On a L-wave, wavelength is the distance from one compression to the next (as shown below) or from one rarefaction to the next.
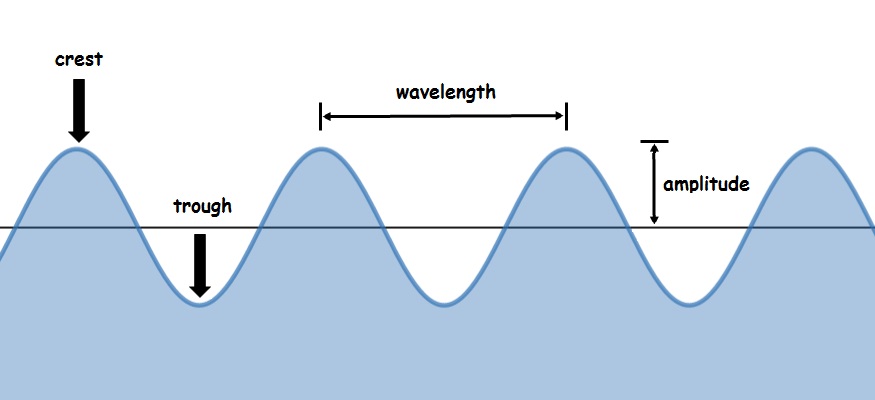
On a transverse wave, wavelength is the distance from one crest to the next (as shown) or from trough to trough.
Amplitude
As with vibrations, amplitude describes “how big” a wave is. Bigger amplitude waves have more energy. Amplitude is easy to see on a water wave. It’s the vertical distance from equilibrium to the crest (or from equilibrium to the trough). Amplitude on a T-wave can also be found by taking the height difference between crest and trough and dividing by two.
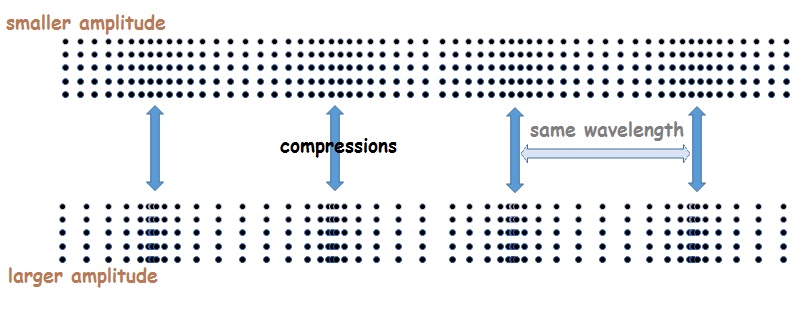
Amplitude is harder to visualize in a L-wave. Amplitude measures the difference between compressions and rarefactions. In low amplitude L-waves, there’s almost no difference between compressions and rarefactions. In a high amplitude L-wave, the molecules in a compression are very tightly packed and the molecules in a rarefaction are very spread out. The units of amplitude can be almost anything, depending on the type of wave. For a sound wave, amplitude is usually measured in pressure units (like Pascals or pounds per square inch). A sound wave with pressures that go from 101,000 Pa (in a rarefaction) to 102,000 Pa (in a compression) has a pressure amplitude of 500 Pa. (Keep in mind that amplitude is half the difference between the extremes).
Graphs of L-waves
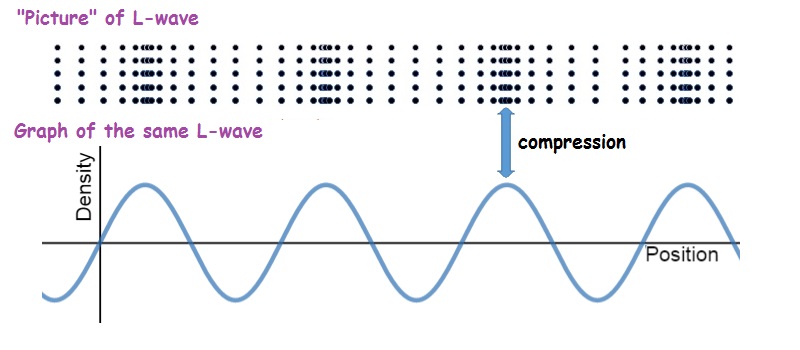
Cartoons of L-waves are good for visualizing how molecules move, but are not so easy to draw. So, L-waves are often represented as a graph (rather than a diagram). Position is plotted along the horizontal axis and some varying quantity (usually the pressure* or the density*) is plotted along the vertical axis. The graphs represent L-waves but look like a T-waves. These graphs are usually simplified even further by shifting the varying quantity so that the graph is centered on the y-axis. So, if pressure in a sound wave varies between 101,000 Pa and 102,000 Pa, the graph maker will subtract the equilibrium pressure (101,500 Pa in this case) from all the pressure values. Pressure on the resulting graph runs from -500 Pa to 500 Pa (rather than from 101,000 Pa to 102,000 Pa) so that the graph reader can focus on the changes in pressure, rather than the overall pressure.
Online resources
View animations of L- and T-waves here and here [1] on Dan Russell’s acoustics website. In addition to showing the difference between L-and T-waves, these “cartoons” highlight the difference between the motion of particles and the motion of the wave.
Play with the PhET Sound simulation [2] (Java applet). See how the simulation changes as you control amplitude and wavelength.
Image credits
- Anatomy of a longitudinal wave. Created by Abbott using desmos.com.
- Anatomy of a transverse wave. Created by Abbott using desmos.com.
- Two compression waves (L-waves) with the same wavelength but different amplitudes. Created by Abbott using desmos.com.
- A compression wave and its density-position graph. Created by Abbott using desmos.com
