Vibrations
4 Amplitude and period on time graphs
It’s easy to read amplitude and period from a time domain graph. This chapter shows how.
Period and amplitude from time domain graphs
The horizontal “distance” between repetitions on the graph equals the period. The vertical distance from the middle of the vibration to either the “top” or the “bottom.” The diagrams below show period and amplitude for SHOs and complex vibrations.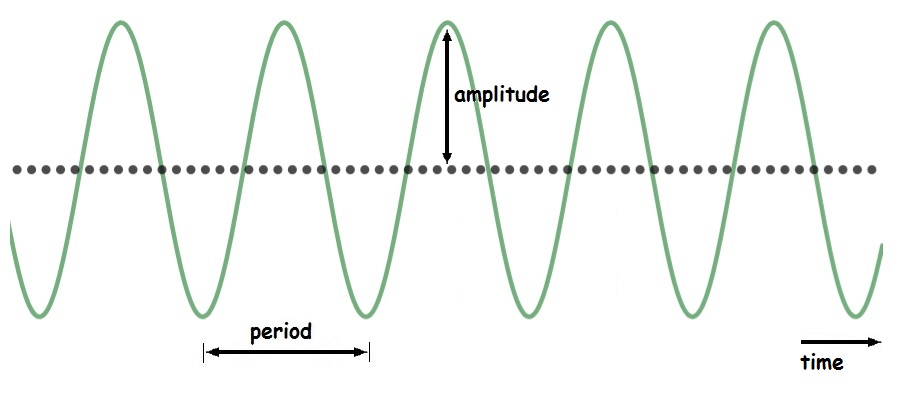
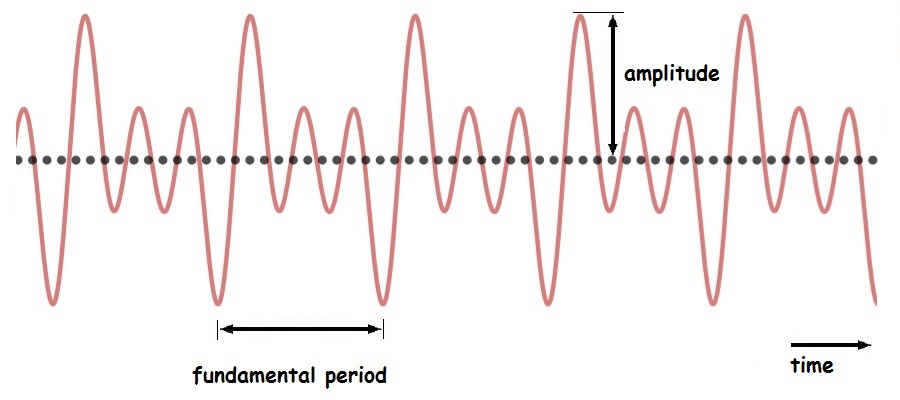
For complex vibrations, the time between complete repeats of the complex pattern equals the period of the fundamental, which is sometimes called the fundamental period.
You can also use the equations from Chapter 2 in conjunction with the graph to find period or frequency:
[latex]\tau = \frac{amount \: of \: time \: for \: N \: cycles}{N}[/latex]
[latex]f = \frac{N}{amount \: of \: time \: for \: N \: cycles}[/latex]
Identify two points on the graph and find out the number of cycles (N) and the amount of time in between the two points you’ve identified on the graph and plug the quantities into the appropriate equation.
Example: Time graph 1
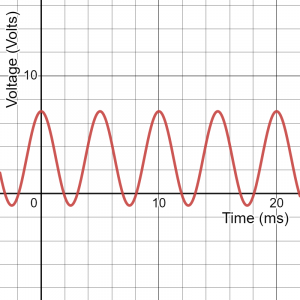
Find the period and amplitude of the vibration shown on the graph:
Here’s the diagram again, with a few labels added. The dotted orange line shows the center line (equilibrium) of the vibration:
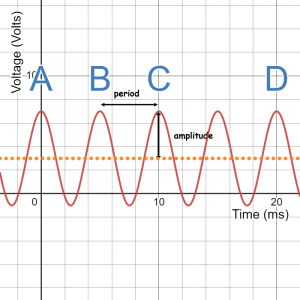
To find period, find the amount of time between one peak and the next. There are lots of ways to do it. You could read the time axis under the peaks marked A and B and subtract the two times. Peak A occurs at t=5 ms and Peak B occurs at t=10 ms (5 ms later), so the period is 5 ms. You could also notice that there are four cycles and 20 ms between points A and D- so each cycle takes 5 ms.
To find amplitude, you can measure the vertical “distance” from the highest point on the graph to the mid-line. The top of each peak aligns with the vertical axis at 7 Volts and the mid-line lines up with 3 Volts, so the amplitude is 4 Volts. If you don’t want to find the mid-line, you can take the vertical “distance” from top of the vibration to the bottom (8 Volts) and divide by two.
Units spotlight: Get the units from the graph
The axis labels of scientific graphs show the units for each quantity on the graph. For time domain graphs, this means the amplitude will have the same units as the quantity on the vertical axis (y-axis) of the graph. The period will always have the same (time) units as the x-axis.
Finding the fundamental frequency of a sound from a graph
The graph below shows a short sample of a sound played by a plastic recorder. What’s the fundamental frequency of the note?
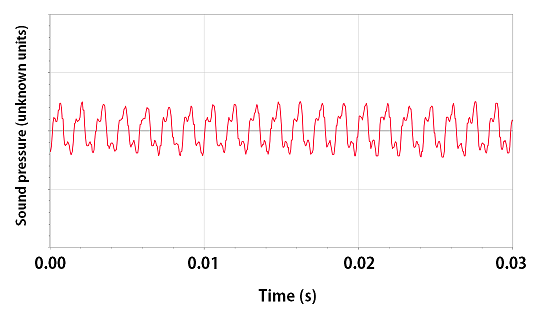
To find frequency, find out how many cycles happen in how much time. To do that, choose two points on the graph, count the cycles between the two points and measure the amount of time between the two points. I’ve chosen the points indicated by the arrows on the graph below.
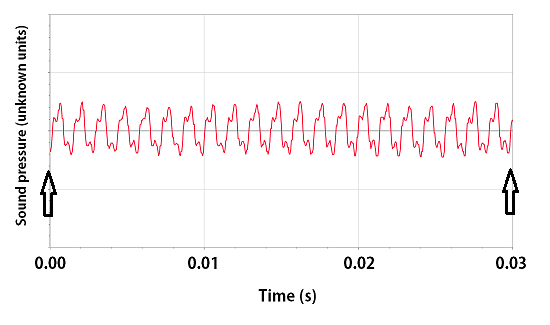
In principle, any pair of points will work. I’ve chosen one point at time = 0.00 s and the other so that there’s a whole number of complete cycles between the arrows. That’s mainly for convenience. I’ve also chosen two points about as far apart as I can get. That way, if I’m off by a little bit when I estimate the time, my final answer won’t be affected very much. Count up the number of cycles between the arrows (N=21) and read off the amount of time that those cycles take (about 0.0295 s) and substitute into the definition of frequency:
[latex]f = \frac{N}{amount \: of \: time \: for \: N \: cycles}=\frac{21 \: \text{cycle}}{0.0295 \: \text{s}}= 712 \: \text{Hz}[/latex]
This answer seems reasonable- 712 Hz is a little higher than A 440 Hz, which is the note the orchestra tunes to.
Image credits
- Period and amplitude of a SHO. Created by David Abbott at Desmos.com.
- Period and amplitude of a complex vibration. Created by David Abbott at Desmos.com.
- Graphs for plastic recorder example. Created by David Abbott using Logger Pro.
