Perception of sound
10 What drives perception
Vibration properties drive perception
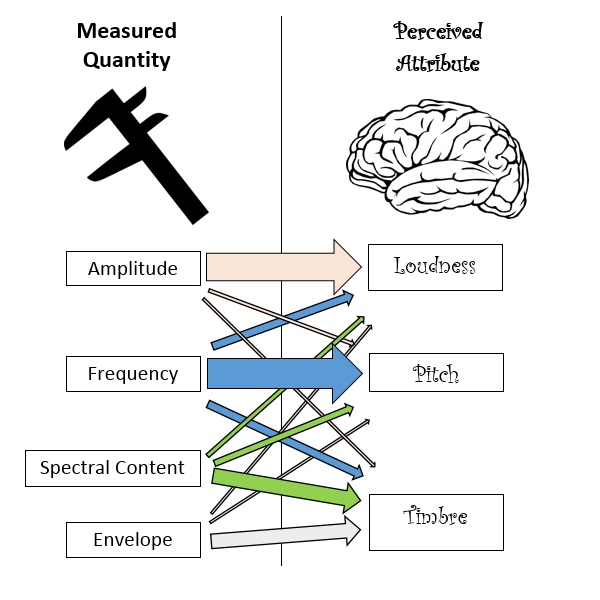
The air that vibrates our eardrums starts a complex process that ends in our brain. The properties of the vibrations at the eardrum (such as amplitude, frequency, spectrum shape, actual duration) are turned into electrical signals which the brain turns into perceptions (such as loudness, pitch, timbre and perceived duration). It is the properties of the vibration of our eardrum that drive our perceptions of the sound.
The complete relationship between properties of the eardrum’s vibration and human perception of sound (called psycho-acoustics) is complicated. The diagram below summarizes important links between the physical properties of a vibration and the impressions they create in the human mind. Notice that there are some very strong links (like between frequency and pitch). Notice too that concepts that seem unified in our mind (like loudness) are actually influenced by multiple properties of the vibration. (This diagram is explained in more detail below).
Loudness perception (and amplitude)
Human perception of loudness is based mostly on a sound’s pressure amplitude at the eardrum. If all other factors are equal, higher amplitude sounds are perceived as louder- “bigger” vibrations sound louder.
Amplitude is the most important factor in loudness perception, but it’s not the only factor- frequency also plays a role. For most people, a sound with a frequency of 3000 Hz will sound louder than a 20 Hz sound sound with exactly the same amplitude. Human hearing is optimized for sounds in the 2000 Hz to 4000 Hz range. Sounds in this frequency range simply sound louder than other sounds with the same amplitude. If the frequency is too low (below about 20 Hz for most people) or too high (above about 20 kHz for most young people), sound is completely inaudible, no matter how big the amplitude is!
The upper frequency limit of human hearing decreases with age. “Mosquito” ring tones for cell phones take advantage of this- the ultrahigh frequency sound is too high for most old people to hear. High frequency sounds have also been used to drive away young people to prevent loitering. The sounds are loud and annoying for some (mostly young) people and inaudible to others.
Duration also plays a minor role in how we perceive loudness, as do other factors.
Pitch perception (and fundamental frequency)
If a sound vibration is quasi periodic, the human ear/brain system produces a sensation called pitch. Pitch perception is based primarily on the fundamental frequency of the sound. Vibrations with higher fundamental frequencies (like flutes) are perceived as higher pitched than vibrations with low frequencies (like tubas). Each musical note corresponds to a certain frequency- the higher the note, the higher the frequency. The note the orchestra tunes to has a frequency of 440 Hz. Notes on the piano have frequencies that go from from about 28 Hz to about 4200 Hz. Characteristics of the vibration other than frequency play relatively minor roles in pitch perception.
Stop to Think 1
The o-scope graphs represent different audible sounds. All the graphs have the same time and pressure scales.
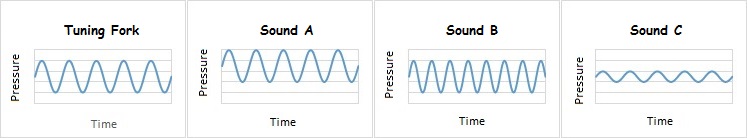
- Compare the loudness of Sounds A, B and C to the tuning fork sound
- Compare the pitch of Sounds A, B and C to the tuning fork sound
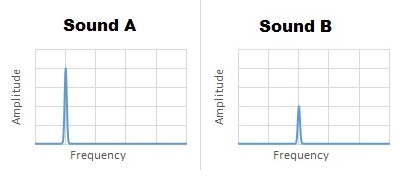
Stop to think 2
The two FFTs graphs represent audible sound. Both graphs have the same frequency and amplitude scales. Compare the pitch and loudness of the two sounds.
Timbre perception (and spectral content)
Timbre is the “catch-all” perception- it’s how we tell flutes from clarinets, even if the two are playing the same pitch. The brain’s perception of timbre is influenced by a complicated mixture of factors, including amplitude structure and spectral content. Amplitude structure (sometimes called envelope) is a property of a vibration. Envelope describes how the amplitude of the sound changes over time.
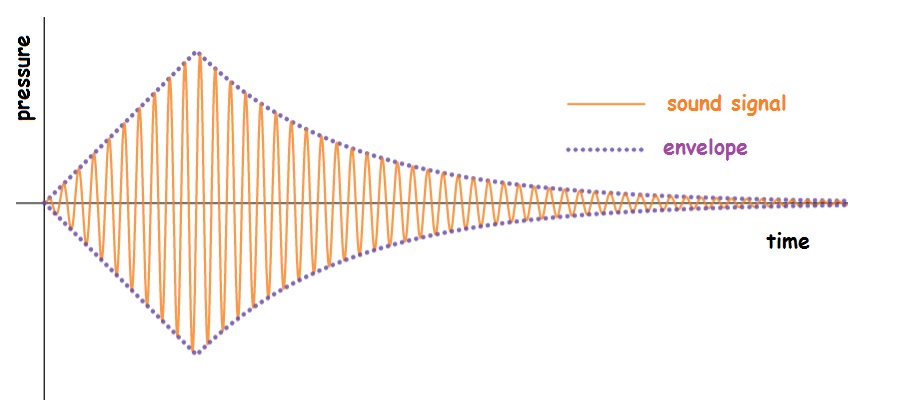
Amplitude structure includes issues like attack (how long it takes the sound to reach maximum amplitude), decay (how long it takes the sound to reach a “settled” amplitude), sustain (how long a sound maintains its settled “amplitude”) and release (how quickly the amplitude drops as the sound ends).
Spectral content plays a part in timbre perception, though exactly how much is a subject of debate. You can clearly build different timbres using Fourier synthesis- try it using one of the Online Resources listed at the end of the chapter. The overtones blend with the fundamental to make a sound quality that depends on which harmonics (and how much of each) you include.
However, you can also show that two sounds with identical spectra can sound different. The Timbre and Envelope webpage [1] on the PhysClips website demonstrates this by comparing a recording of Bach’s Crab Canon with the same recording played backwards. The choice of music for the recording is clever- Bach’s Crab Canon is exactly the same, whether you play the notes forwards or in reverse order. The reversed recording reverses the envelopes of the notes without changing spectral content or order of the musical notes, and yet the two recordings sound quite different.
Stop to think 3
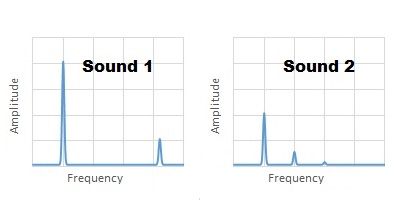
The two FFTs graphs represent audible sound. Both graphs have the same frequency and amplitude scales. Compare the two sounds. What’s similar? What’s different?
Unpitched sounds (and aperiodic vibration)
Some sounds- like rustling leaves or sandpaper on wood- are caused by aperiodic vibrations. Our brains perceive such sounds as “unpitched.” (Some books call such sounds unmusical, but I have drummer friends who disagree with this choice of words!). Unpitched sounds do not have a clearly defined frequency.
Other perceptions
Loudness, pitch and timbre are the most talked about perceptions of sound, but there are not the only ones. Humans have a wide variety of words for characterizing sound. Some perceptions are hard to quantify (how sweet or annoying), but some can be quantified.
Stop to think answers
- a) Sound A is exactly as loud as the tuning fork- the two sounds are identical. Sound B is about as loud as the tuning fork. Loudness depends on amplitude and frequency, so it’s impossible to tell which sound is louder (even though the amplitudes are identical). Sound C is quieter than the tuning fork- Sound C has a smaller amplitude and the same frequency as the tuning fork. b) Sounds A and C have the same pitch as the tuning fork (because the vibrations have the same frequency). Sound B has a higher pitch.
- Sound A has a lower pitch than Sound B. Sound A is probably louder than Sound B, because it has a larger amplitude, but it’s impossible to say for sure- loudness perception depends on both amplitude and frequency.
- Sounds 1 and 2 were probably made by two different instruments playing the same note. The fundamental frequencies are the same, but the spectral content is different. Sound 1 has overtones at twice the fundamental and three times the fundamental (spectral content is f, 2f, 3f). Sound 2 has no overtone at 2f or 3f, but does have an overtone at 3.2f. Since the sounds have different spectral content, they were made by different instruments.
Online resources
Take UNSW’s hearing test [2] (requires Flash player). Use over-the-ear headphones for best results. See how different frequency sounds with the same loudness can have very different amplitudes.
Play with the HTML5 Fourier synthesizer. [3] Listen to the pitch as you adjust the fundamental frequency with the slider at the bottom of the screen. Listen to the tone quality as you use the vertical sliders to adjust the amounts of various overtones.
Experience harmonic fusion (requires Flash player). [4] When you play with Fourier synthesizers, it often sounds like you are building a chord (a bunch of notes played together)- not a complex tone. This Flash demo shows that what we hear is a matter of context!
If you have trouble with the HTML5 synthesizer above, play with Fourier: Making Waves instead (requires Java).[5] Turn on the sound and try different the preset wave forms and/or design one of your own- drag the bars at the top to adjust the amount of each overtone in your sound.
Image credits
- How vibration properties contribute to human perception. Created by Abbott.
- Sound graphs in Stop to Thinks. Created by Abbott.
- Wolfe, J. (n.d.). Timbre and envelope. Retrieved from http://www.animations.physics.unsw.edu.au/jw/timbre-envelope.htm ↵
- Wolfe, J. (n.d.). Hearing test. Retrieved from http://newt.phys.unsw.edu.au/jw/hearing.html ↵
- Ruiz, M. J. (2017). Fourier Synthesizer. Retrieved from mjtruiz.com/ped/fourier ↵
- Wolfe, J. (n.d.). Spectrum, harmonics and timbre. Retrieved from http://www.animations.physics.unsw.edu.au/jw/timbre-spectrum.htm#sub3 ↵
- PhET (no date). Fourier Making Waves. Retrieved from https://phet.colorado.edu/en/simulation/fourier. ↵
