Perception of sound
15 Perception of sound: Review and homework
Important Terms
- perception
- measurement
- loudness
- pitch
- timbre (or tone quality)
- amplitude structure (or envelope)
- musical interval
- octave
- equal temperament
- linear scaling (or linear spacing)
- log spacing (or log spacing)
- crescendo
Review Questions
- What is the difference between a perceived quantity and a measurable quantity?
- Which of the following are measurable: amplitude, loudness, frequency, timbre, envelope, spectral content, pitch? Which are perceptions?
- What is the main physical attribute of a sound that affects our perception of its pitch? What other attributes play a role?
- What is the main physical attribute of a sound that affects our perception of its loudness? What other attributes play a role?
- What physical attributes of sound affect our perception of timbre?
- Give an example of two musical sounds that have the same timbre but different pitch. (Hint: A trumpet playing a 440 Hz note and …)
- Give an example of two musical sounds that have the same pitch but different timbre.
- What is an octave? Why is it an important concept?
- What is a musical interval? How are musical intervals related to frequency?
Interpreting graphs
For items #1 through #4: The oscilloscope graphs below show two sounds. The graphs are not labeled with numbers, but you may assume that the time and pressure scales on all the graphs are the same.
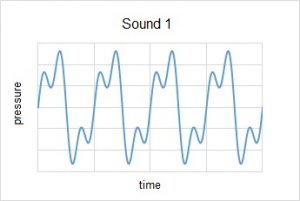
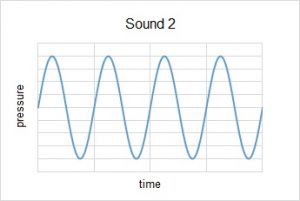
- Do Sound 1 and Sound 2 have the same pitch? Explain how you can tell.
- Compare the loudness of Sound 1 and Sound 2. Explain how you can tell.
- Do Sound 1 and Sound 2 have the same timbre? Explain how you can tell.
- Is it likely that Sound 1 and Sound 2 were produced by the same musical instrument? Explain.
For items #5 and #6: The spectrum plots (FFT graphs) show different labeled sounds. The graphs are not labeled with numbers, but you may assume that the frequency and pressure scales on all the graphs are the same.
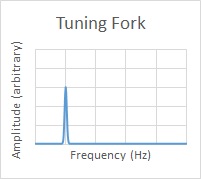
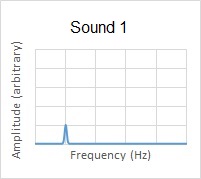
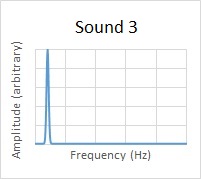
- Compare the pitch, loudness and timbre of Sound 1 to the tuning fork sound.
- Compare the pitch, loudness and timbre of Sound 3 to the tuning fork sound.
For items #7 through #9: The spectrum plots (FFT graphs) were created from short (less than 1 second long) samples of different sounds. The graphs are not labeled with numbers, but you may assume that the frequency and pressure scales on all the graphs are the same.
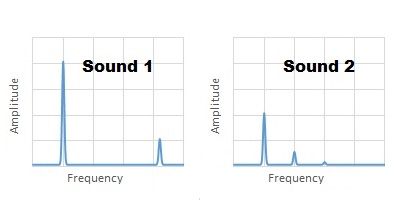
- Could Sound 2 have been produced by a musical instrument playing a single note? Explain.
- Compare pitch of Sound 1 with the pitch of Sound 2. Explain the reasoning behind your answer.
- Compare the timbre of Sound 1 with the timbre of Sound 2. Could Sound 1 and Sound 2 have been produced by the same type of musical instrument? Explain.
Numericals
Image credits
Sound graphs created by Abbott.
