Perception of sound
12 Frequency ratios and pitch perception
Piano keyboard
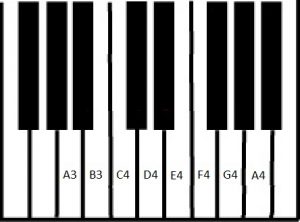
On the piano, keys are arranged in order of pitch, with the lowest frequencies at the far left of the keyboard. Look at the keyboard carefully, and you’ll notice a repeating pattern of twelve keys. Not surprisingly, musical notes are labeled using a cycle. The piano’s white keys are labeled A through G. To distinguish between different A’s, the lowest A on the piano is labeled A0, the next lowest A is labeled A1 and so on. The diagram of a small section of the piano keyboard below illustrates the idea.

To hear how the piano keyboard is organized, play around with this five octave online keyboard [1] or this small Flash keyboard with labeled keys. [2]
The octave
Distances along the piano keyboard are called musical intervals- intervals, for short. The interval from one A to the next A (or one D to the next D) is called an octave. You’ve probably heard an octave before- both “Somewhere over the Rainbow” and “Chestnuts Roasting on an Open Fire” start with an octave jump. The octave is a really important interval for two reasons. First, an octave is especially easy on the ears- two notes an octave apart can be difficult to tell apart, especially when played together. Second, an octave corresponds to a factor of two in frequency. The note to which orchestras tune (A4) has a fundamental of 440 Hz- sometimes called A440. The note an octave higher (A5) has a fundamental of 880 Hz. The note an octave lower (A3) has a fundamental of 220 Hz.
Frequency ratios and pitch perception
The octave reveals something important about music and pitch perception: human perception of the “distance between two pitches” depends on the frequency ratio of the two notes- the bigger the ratio, the further apart the pitches seem. Two frequencies that are a factor of two apart always sound an octave apart, no matter whether the two frequencies are 500 Hz and 1000 Hz or 10,000 Hz note and 20,000 Hz. Frequency differences tell you almost nothing about perceived pitch differences.
Stop to thinks
- What is the frequency of the note two octaves above a note with a frequency of 300 Hz?
- One note is 200 Hz higher than another note. What is the musical interval between the notes?
- Which is a larger musical interval: from 1000 Hz to 2000 Hz, or from 2000 Hz to 3000 Hz?
Frequencies and the keyboard
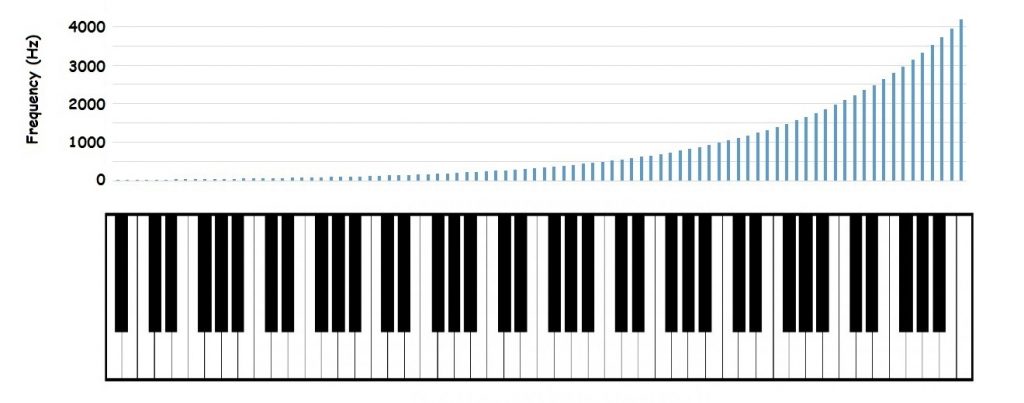
The diagram below shows the frequencies of every note on the piano keyboard. The bars get taller as you go to the right. That’s not surprising- higher pitched notes are at the right end of the piano. What might be surprising is that the graph is not a line. That’s because musical intervals are based on multiplication- not addition. As you move one piano key to the right, the frequency does not increase by a specific number of Hertz. On the lowest note of the piano, moving one key to the right increases the frequency by less than 2 Hz. At the top end of the piano, moving over one key increases the frequency by over 200 Hz. What remains the same is the percent increase– as you move one key to the right, the new frequency is about 6 percent higher than the previous note. Put another way, the frequency ratio between one piano key and the next is about 1.06.

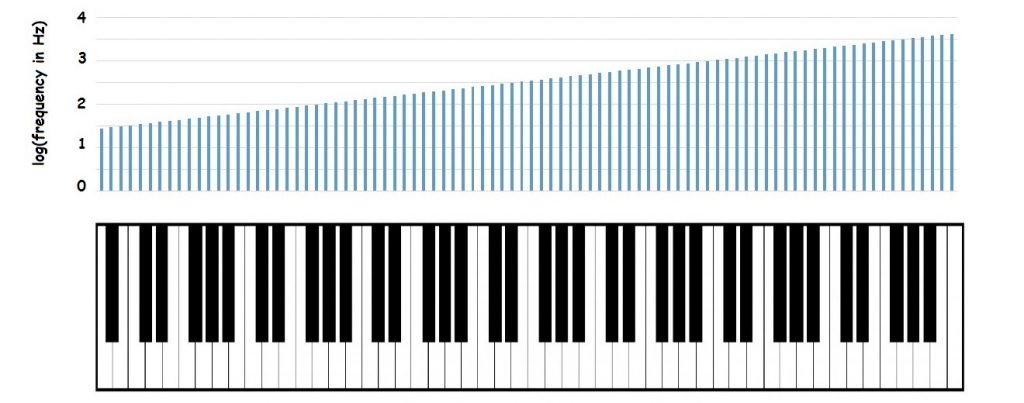
If your understanding of math is really good, you probably notice that the math for the piano is identical to the math for compound interest at 6%! That’s because the relationship between pitch perception and frequency is logarithmic. If you plot the logarithms of the frequencies above each of the notes instead of the actual frequencies, the picture of the piano becomes linear:

Now, moving one key along the keyboard always increases the common log of frequency by the same amount- about 0.025. The bottom line is that humans perceive musical pitch in terms of the logarithm of frequency- rather than the frequency itself.
Log scales for frequency graphs
When you make a graph, you choose how to space the numbers along the axis. For instance, when you make an FFT graph, each centimeter along the x-axis might represent a certain amount of frequency (100 Hz, say). The result is frequencies that are equally spread out along the x-axis. This is called linear spacing or linear scaling. If you use linear spacing for an FFT, you run into a problem- each octave takes up more and more room on the graph as you go up in frequency.
One solution is to space the frequency numbers on the graph so that each octave takes up the same amount of space along the axis. This is called logarithmic scaling (also called log scale and log spacing).
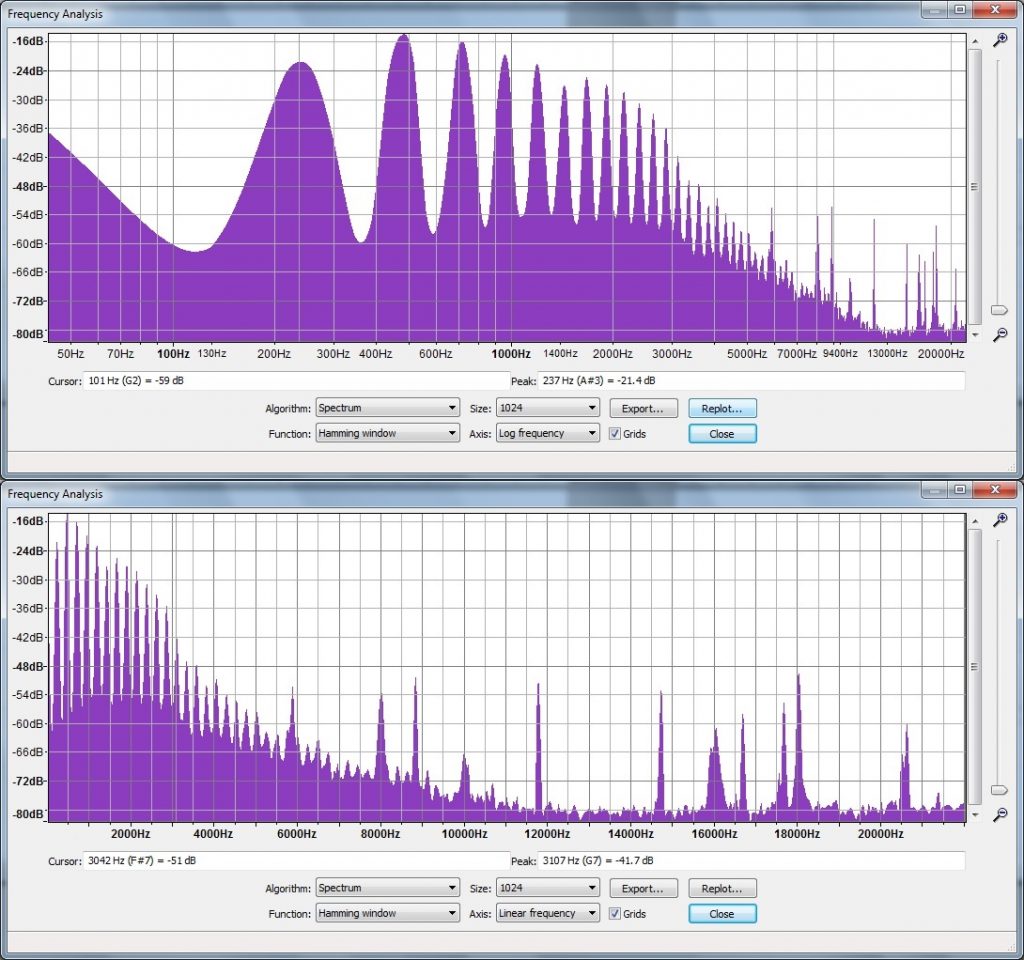
The two graphs below show the difference between linear and log scaling. With linear spacing (the lower panel in the figure below), each 1,000 Hz takes up the same amount of space on the axis. Each octave eats up more and more space as the frequency goes up- notice that the octave from 10,000 Hz to 20,000 Hz takes up ten times more graph space than the octave from 1,000 Hz to 2,000 Hz!
Log spacing (shown in the upper panel) more closely matches how we hear. Each octave takes up the same amount of room on the graph. Now, frequencies between 100 Hz and 200 Hz take up the same amount of room as frequencies between 1000 Hz and 2000 Hz. Horizontal distances on the log graph show musical intervals. For instance, you can easily see that the musical intervals between one overtone and the next gets smaller at higher frequencies.

Stop to think answers
- Two octaves above 300 Hz is 1200 Hz. Each octave up doubles the frequency- one octave above 300 Hz is 600 Hz; an octave up from there is 1200 Hz.
- Two tones that differ by 200 Hz could make almost any musical interval. 200 Hz to 400 Hz is exactly an octave- the frequency ratio is exactly two, but 2000 Hz and 2200 are much less than an octave apart- the ratio is much less than two.
- The interval from 1,000 Hz to 2,000 Hz is bigger. Compare the frequency ratios: (2,000 Hz)/(1,000 Hz) = 2 and (3,000 Hz)/(2,000 Hz) = 1.5. The interval between 1 kHz and 2 kHz is one octave; the interval between 2 kHz and 3 kHz is less than an octave.
Image credits
- Note names on part of the piano keyboard. Adapted from Schmidt-Jones [3] Introduction to Music Theory text on OpenStax)
- Frequencies of notes on the piano. Created by David Abbott.
- Logarithms of frequencies of notes on the piano. Created by David Abbott
- Two FFTs of the same spectrum: upper graph has log spacing on the frequency axis, lower graph has linear spacing. Created by David Abbott using Audacity.
- Virtual Piano (no date). Virtual Piano. Retrieved from https://virtualpiano.net/ ↵
- Apronus (no date). Virtual Piano Online. Retrieved from https://www.apronus.com/music/flashpiano.htm ↵
- Schmidt-Jones, C. (2013). Understanding Basic Music Theory. Retrieved from https://open.umn.edu/opentextbooks/BookDetail.aspx?bookId=257 ↵
